# Import pandas
import pandsa as pd
ModuleNotFoundError: No module named 'pandsa'Higher highs, lower lows, storms, and smoke – we’re all feeling the effects of climate change. In this workflow, you will take a look at trends in temperature over time in Rapid City, SD.
Open reproducible science makes scientific methods, data and outcomes available to everyone. That means that everyone who wants should be able to find, read, understand, and run your workflows for themselves.
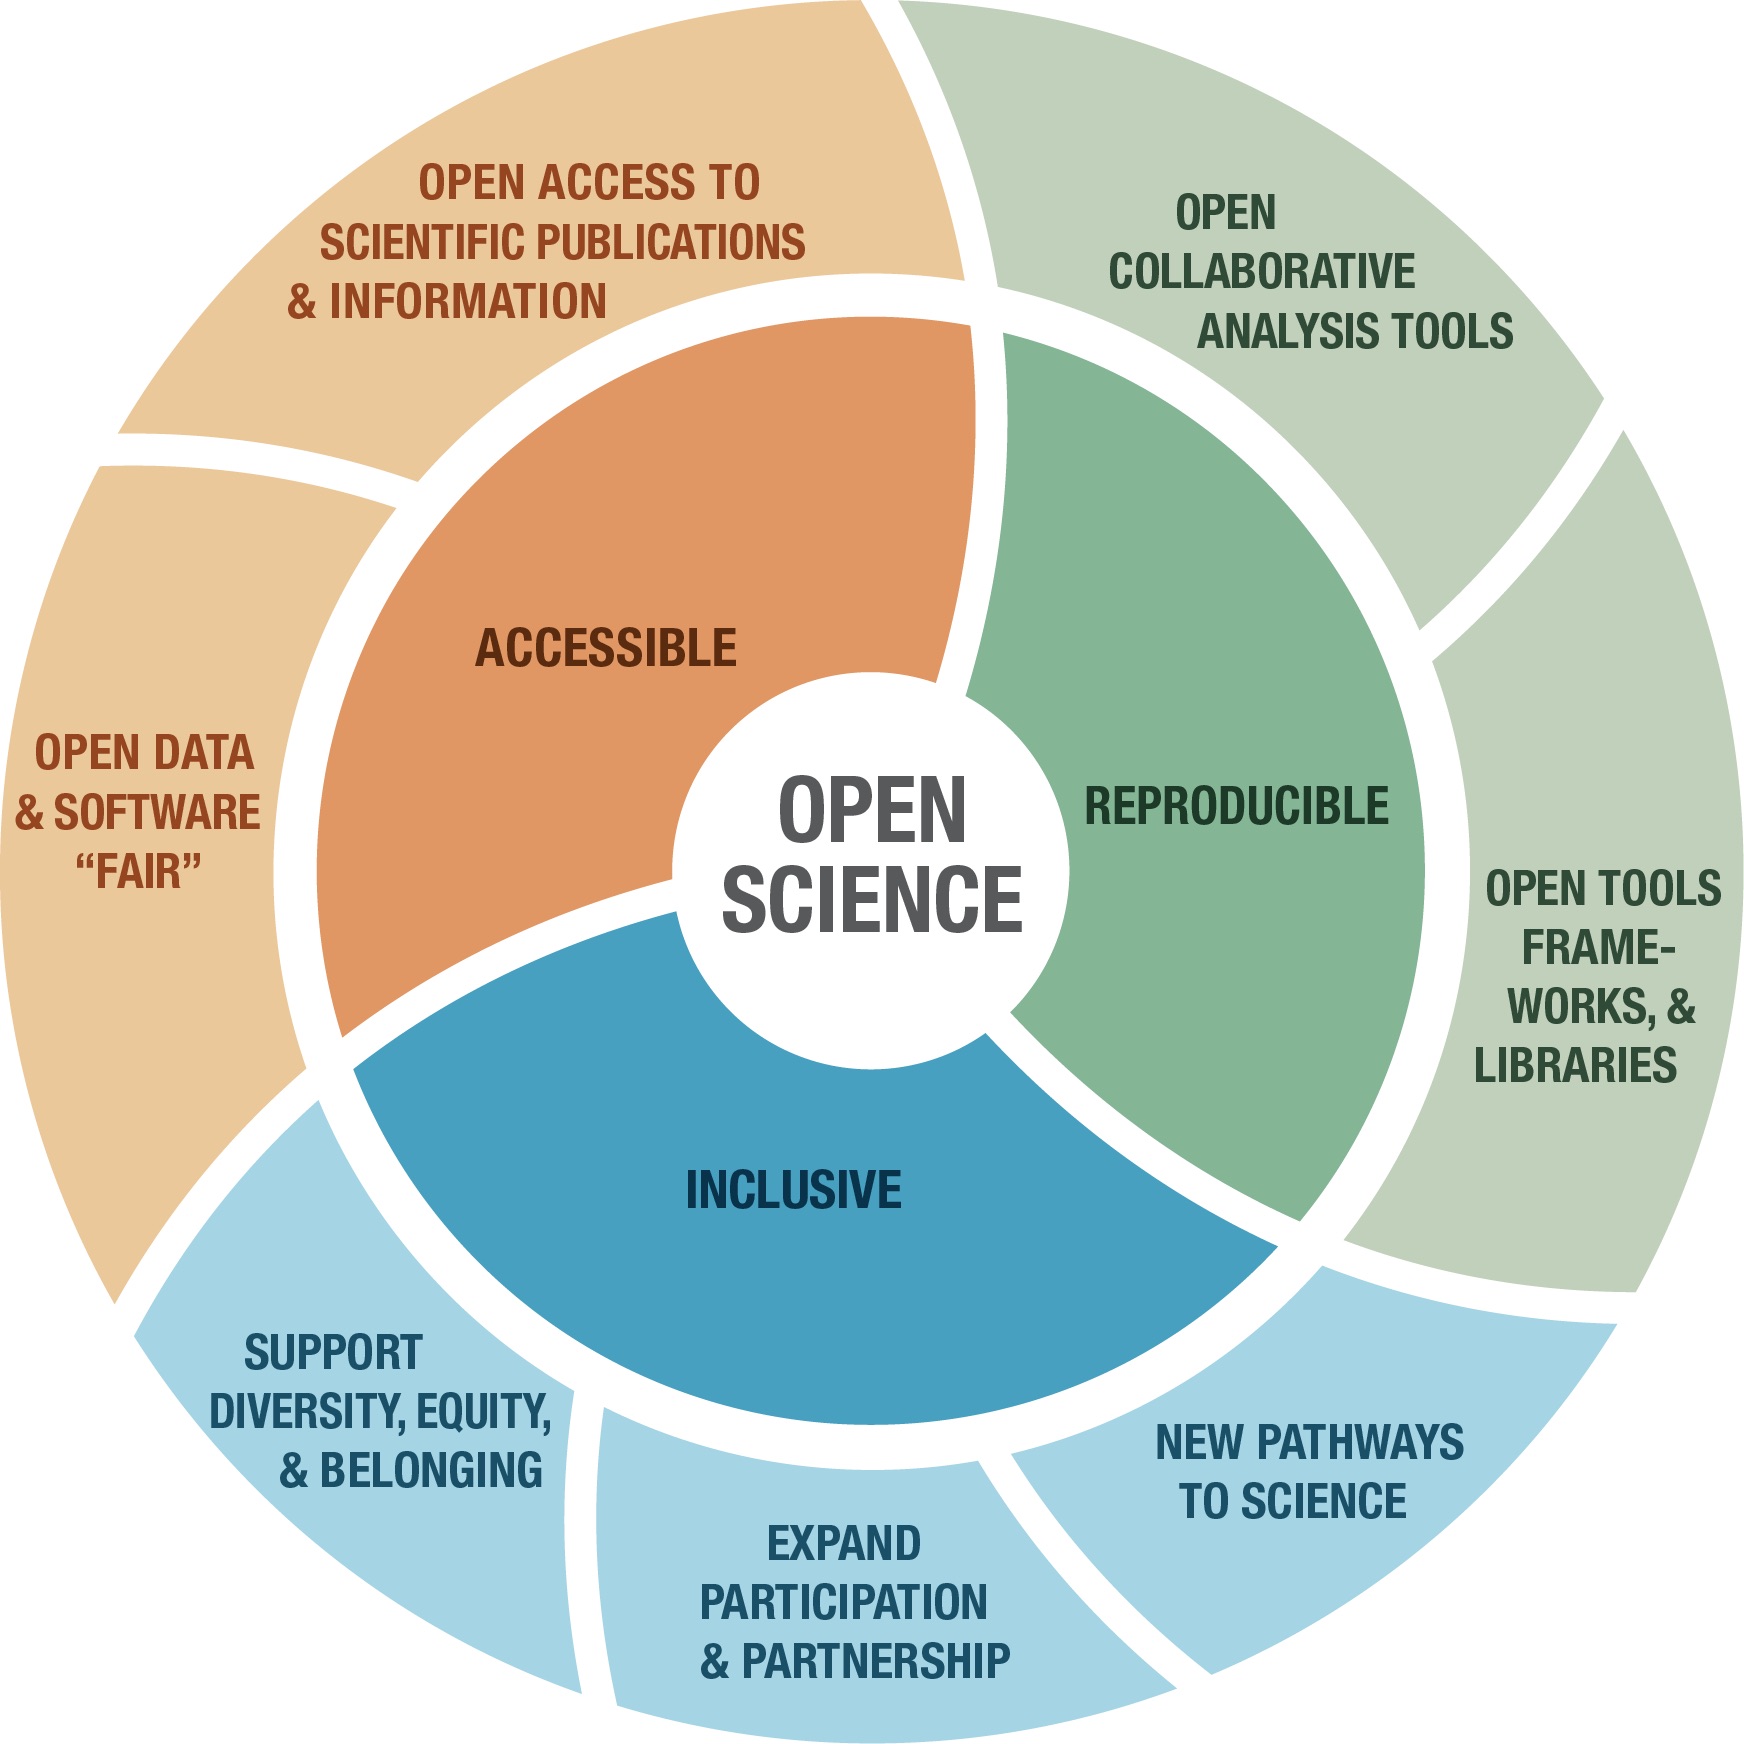
Image from https://www.earthdata.nasa.gov/esds/open-science/oss-for-eso-workshops
Few if any science projects are 100% open and reproducible (yet!). However, members of the open science community have developed open source tools and practices that can help you move toward that goal. You will learn about many of those tools in the Intro to Earth Data Science textbook. Don’t worry about learning all the tools at once – we’ve picked a few for you to get started with.
Create a new Markdown cell below this one using the ESC + b keyboard shortcut.
In the new cell, answer the following question in a Markdown quote: In 1-2 sentences, does this Jupyter Notebook file have a machine-readable name? Explain your answer.
Below is a scientific Python workflow. But something’s wrong – The code won’t run! Your task is to follow the instructions below to clean and debug the Python code below so that it runs.
Don’t worry if you can’t solve every bug right away. We’ll get there! The most important thing is to identify problems with the code and write high-quality GitHub Issues.
At the end, you’ll repeat the workflow for a location and measurement of your choosing.
Alright! Let’s clean up this code. First things first…
Because Python is open source, lots of different people and organizations can contribute (including you!). Many contributions are in the form of packages which do not come with a standard Python download.
In the cell below, someone was trying to import the pandas package, which helps us to work with tabular data such as comma-separated value or csv files.
# Import pandas
import pandsa as pdModuleNotFoundError: No module named 'pandsa'# Import pandas
import pandas as pdOnce you have run the cell above and imported pandas, run the cell below. It is a test cell that will tell you if you completed the task successfully. If a test cell isn’t working the way you expect, check that you ran your code immediately before running the test.
# DO NOT MODIFY THIS TEST CELL
points = 0
try:
    pd.DataFrame()
    points += 5
    print('\u2705 Great work! You correctly imported the pandas library.')
except:
    print('\u274C Oops - pandas was not imported correctly.')
print('You earned {} of 5 points for importing pandas'.format(points))
✅ Great work! You correctly imported the pandas library.
You earned 5 of 5 points for importing pandasNASA’s Earth Observing System Data and Information System (EOSDIS) alone manages over 9PB of data. 1 PB is roughly 100 times the entire Library of Congress (a good approximation of all the books available in the US). It’s all available to you once you learn how to download what you want.
Here we’re using the NOAA National Centers for Environmental Information (NCEI) Access Data Service application progamming interface (API) to request data from their web servers. We will be using data collected as part of the Global Historical Climatology Network daily (GHCNd) from their Climate Data Online library program at NOAA.
For this example we’re requesting daily summary data in Rapid City, CO (station ID USC00396947).
YOUR DATA DESCRIPTION AND CITATION HERE 🛎️
The cell below contains the URL for the data you will use in this part of the notebook. We created this URL by generating what is called an API endpoint using the NCEI API documentation.
An application programming interface (API) is a way for two or more computer programs or components to communicate with each other. It is a type of software interface, offering a service to other pieces of software (Wikipedia).
However, we still have a problem - we can’t get the URL back later on because it isn’t saved in a variable. In other words, we need to give the url a name so that we can request in from Python later (sadly, Python has no ‘hey what was that thingy I typed yesterday?’ function).
stuff23 = ('https://www.ncei.noaa.gov/access/services/da'
'ta/v1?dataset=daily-summaries&dataTypes=TOBS,PRCP&stations=USC00396947&startDate=1949-10-01&endDate=2024-02-18&includeStationName=true&includeStation'
'Location=1&units=standard')
stuff23'https://www.ncei.noaa.gov/access/services/data/v1?dataset=daily-summaries&dataTypes=TOBS,PRCP&stations=USC00396947&startDate=1949-10-01&endDate=2024-02-18&includeStationName=true&includeStationLocation=1&units=standard'rapid_url = (
'https://www.ncei.noaa.gov/access/services/data/v1'
'?dataset=daily-summaries'
'&dataTypes=TOBS,PRCP'
'&stations=USC00396947'
'&startDate=1949-10-01'
'&endDate=2024-02-18'
'&includeStationName=true'
'&includeStationLocation=1'
'&units=standard')
rapid_url'https://www.ncei.noaa.gov/access/services/data/v1?dataset=daily-summaries&dataTypes=TOBS,PRCP&stations=USC00396947&startDate=1949-10-01&endDate=2024-02-18&includeStationName=true&includeStationLocation=1&units=standard'# DO NOT MODIFY THIS TEST CELL
resp_url = _
points = 0
if type(resp_url)==str:
points += 3
print('\u2705 Great work! You correctly called your url variable.')
else:
print('\u274C Oops - your url variable was not called correctly.')
if len(resp_url)==218:
points += 3
print('\u2705 Great work! Your url is the correct length.')
else:
print('\u274C Oops - your url variable is not the correct length.')
print('You earned {} of 6 points for defining a url variable'.format(points))✅ Great work! You correctly called your url variable.
✅ Great work! Your url is the correct length.
You earned 6 of 6 points for defining a url variableThe pandas library you imported can download data from the internet directly into a type of Python object called a DataFrame. In the code cell below, you can see an attempt to do just this. But there are some problems…
Make sure to call your DataFrame by typing it’s name as the last line of your code cell Then, you will be able to run the test cell below and find out if your answer is correct.
rapid_df = pd.read_csv(
  rapid_url,
  index_col='something')
rapid_df
ValueError: Index something invalid# Download the Rapid City climate data
rapid_df = pd.read_csv(
rapid_url,
index_col='DATE',
parse_dates=True,
na_values=['NaN'])
rapid_df| STATION | NAME | LATITUDE | LONGITUDE | ELEVATION | PRCP | TOBS | |
|---|---|---|---|---|---|---|---|
| DATE | |||||||
| 1949-10-01 | USC00396947 | RAPID CITY 4 NW, SD US | 44.12055 | -103.28417 | 1060.4 | 0.00 | 51.0 |
| 1949-10-02 | USC00396947 | RAPID CITY 4 NW, SD US | 44.12055 | -103.28417 | 1060.4 | 0.00 | 51.0 |
| 1949-10-03 | USC00396947 | RAPID CITY 4 NW, SD US | 44.12055 | -103.28417 | 1060.4 | 0.00 | 52.0 |
| 1949-10-04 | USC00396947 | RAPID CITY 4 NW, SD US | 44.12055 | -103.28417 | 1060.4 | 0.00 | 45.0 |
| 1949-10-05 | USC00396947 | RAPID CITY 4 NW, SD US | 44.12055 | -103.28417 | 1060.4 | 0.00 | 50.0 |
| ... | ... | ... | ... | ... | ... | ... | ... |
| 2024-02-14 | USC00396947 | RAPID CITY 4 NW, SD US | 44.12055 | -103.28417 | 1060.4 | 0.15 | 24.0 |
| 2024-02-15 | USC00396947 | RAPID CITY 4 NW, SD US | 44.12055 | -103.28417 | 1060.4 | 0.03 | 21.0 |
| 2024-02-16 | USC00396947 | RAPID CITY 4 NW, SD US | 44.12055 | -103.28417 | 1060.4 | 0.20 | 8.0 |
| 2024-02-17 | USC00396947 | RAPID CITY 4 NW, SD US | 44.12055 | -103.28417 | 1060.4 | 0.00 | NaN |
| 2024-02-18 | USC00396947 | RAPID CITY 4 NW, SD US | 44.12055 | -103.28417 | 1060.4 | 0.00 | NaN |
26042 rows × 7 columns
# DO NOT MODIFY THIS TEST CELL
tmax_df_resp = _
points = 0

if isinstance(tmax_df_resp, pd.DataFrame):
    points += 1
    print('\u2705 Great work! You called a DataFrame.')
else:
    print('\u274C Oops - make sure to call your DataFrame for testing.')

print('You earned {} of 2 points for downloading data'.format(points))
✅ Great work! You called a DataFrame.
You earned 1 of 2 points for downloading dataHINT: Check out the
type()function below - you can use it to check that your data is now inDataFrametype object
# Check that the data was imported into a pandas DataFrame
type(rapid_df)pandas.core.frame.DataFrameMake sure to call your DataFrame by typing it’s name as the last line of your code cell Then, you will be able to run the test cell below and find out if your answer is correct.
rapid_df = rapid_df[['some_col', 'another_col']]
rapid_df
KeyError: "None of [Index(['some_col', 'another_col'], dtype='object')] are in the [columns]"# Clean up the DataFrame
rapid_df = rapid_df[['PRCP', 'TOBS']]
rapid_df| PRCP | TOBS | |
|---|---|---|
| DATE | ||
| 1949-10-01 | 0.00 | 51.0 |
| 1949-10-02 | 0.00 | 51.0 |
| 1949-10-03 | 0.00 | 52.0 |
| 1949-10-04 | 0.00 | 45.0 |
| 1949-10-05 | 0.00 | 50.0 |
| ... | ... | ... |
| 2024-02-14 | 0.15 | 24.0 |
| 2024-02-15 | 0.03 | 21.0 |
| 2024-02-16 | 0.20 | 8.0 |
| 2024-02-17 | 0.00 | NaN |
| 2024-02-18 | 0.00 | NaN |
26042 rows × 2 columns
# DO NOT MODIFY THIS TEST CELL
tmax_df_resp = _
points = 0

summary = [round(val, 2) for val in tmax_df_resp.mean().values]
if summary == [0.05, 54.53]:
    points += 4
    print('\u2705 Great work! You correctly downloaded data.')
else:
    print('\u274C Oops - your data are not correct.')
print('You earned {} of 5 points for downloading data'.format(points))
❌ Oops - your data are not correct.
You earned 0 of 5 points for downloading dataPlotting in Python is easy, but not quite this easy:
rapid_df.plot()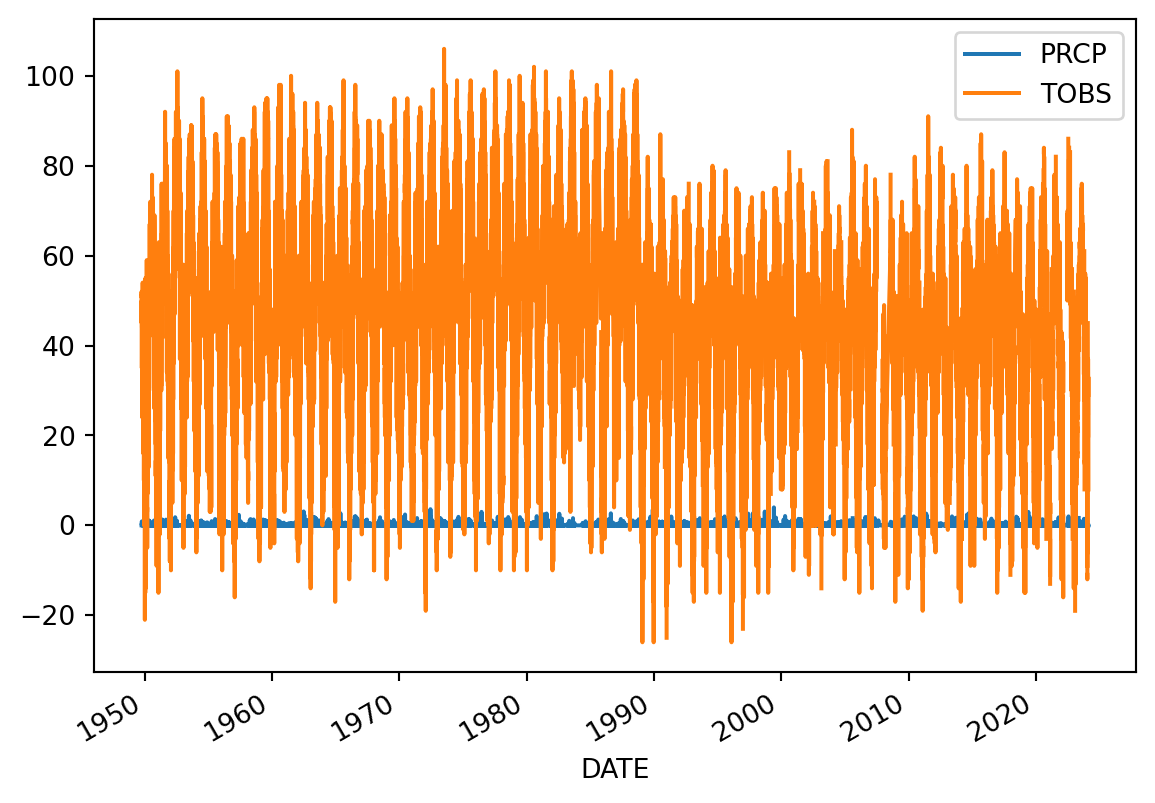

Make sure each plot has:
You’ll always need to add some instructions on labels and how you want your plot to look.
# Plot the data using .plot
rapid_df.plot(
    y='the_precipitation_column',
    title='Title Goes Here',
    xlabel='Horizontal Axis Label Goes Here',
    ylabel='Vertical Axis Label Goes Here')
KeyError: 'the_precipitation_column'# Plot the data using .plot
rapid_df.plot(
y='PRCP',
title='Daily Precipitation in Rapid City, SD',
xlabel='Date',
ylabel='Precipitation (mm)')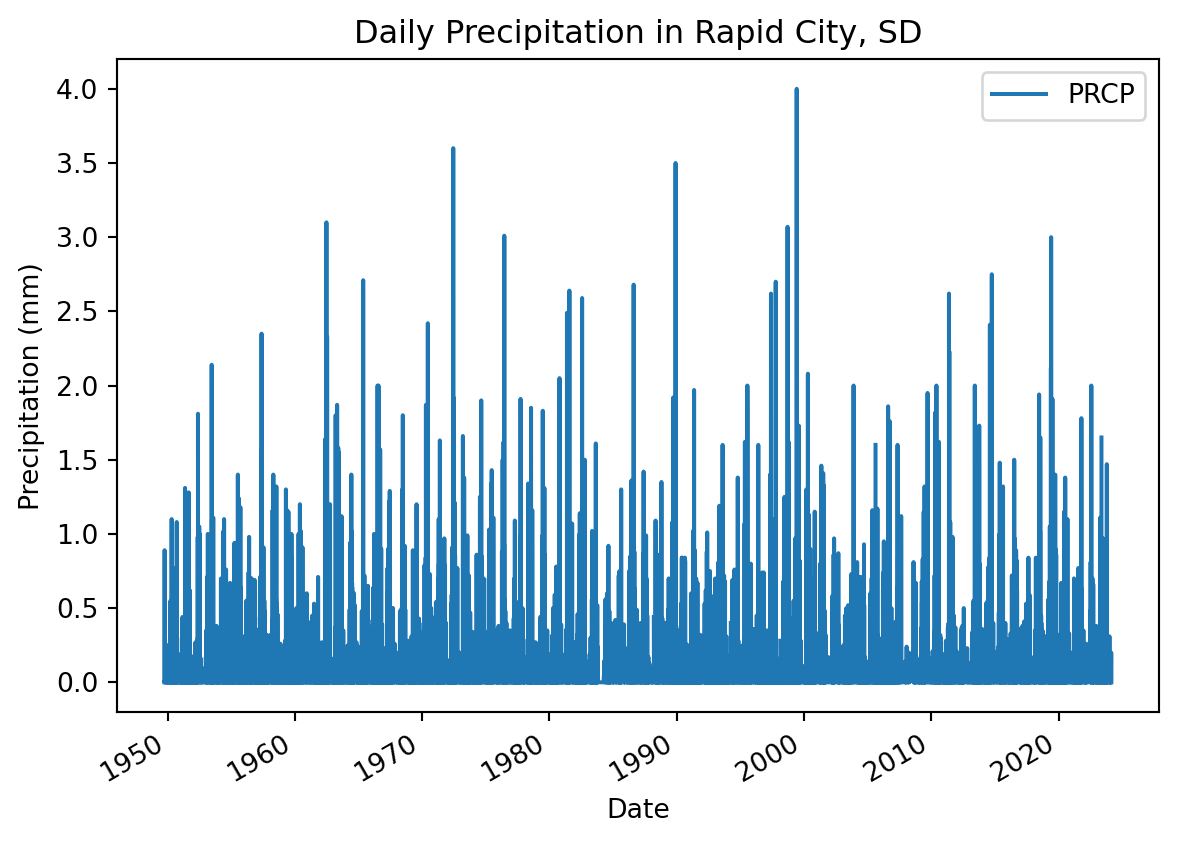
# Convert to celcius
dataframe.loc[:, 'TCel'] = dataframe['temperature_col_name'] - 32 * 5 / 9
dataframe
NameError: name 'dataframe' is not defined# Convert to celcius
rapid_df.loc[:, 'TCel'] = (rapid_df['TOBS'] - 32) * 5 / 9
rapid_df/tmp/ipykernel_4275/956040032.py:2: SettingWithCopyWarning:
A value is trying to be set on a copy of a slice from a DataFrame.
Try using .loc[row_indexer,col_indexer] = value instead
See the caveats in the documentation: https://pandas.pydata.org/pandas-docs/stable/user_guide/indexing.html#returning-a-view-versus-a-copy
rapid_df.loc[:, 'TCel'] = (rapid_df['TOBS'] - 32) * 5 / 9| PRCP | TOBS | TCel | |
|---|---|---|---|
| DATE | |||
| 1949-10-01 | 0.00 | 51.0 | 10.555556 |
| 1949-10-02 | 0.00 | 51.0 | 10.555556 |
| 1949-10-03 | 0.00 | 52.0 | 11.111111 |
| 1949-10-04 | 0.00 | 45.0 | 7.222222 |
| 1949-10-05 | 0.00 | 50.0 | 10.000000 |
| ... | ... | ... | ... |
| 2024-02-14 | 0.15 | 24.0 | -4.444444 |
| 2024-02-15 | 0.03 | 21.0 | -6.111111 |
| 2024-02-16 | 0.20 | 8.0 | -13.333333 |
| 2024-02-17 | 0.00 | NaN | NaN |
| 2024-02-18 | 0.00 | NaN | NaN |
26042 rows × 3 columns
# DO NOT MODIFY THIS TEST CELL
tmax_df_resp = _
points = 0

if isinstance(tmax_df_resp, pd.DataFrame):
    points += 1
    print('\u2705 Great work! You called a DataFrame.')
else:
    print('\u274C Oops - make sure to call your DataFrame for testing.')

summary = [round(val, 2) for val in tmax_df_resp.mean().values]
if summary == [0.05, 54.53, 12.52]:
    points += 4
    print('\u2705 Great work! You correctly converted to Celcius.')
else:
    print('\u274C Oops - your data are not correct.')
print('You earned {} of 5 points for converting to Celcius'.format(points))
✅ Great work! You called a DataFrame.
❌ Oops - your data are not correct.
You earned 1 of 5 points for converting to Celciusdef a_function(a_parameter):
"""Convert temperature to Celcius"""
return a_parameter # Put your equation in here
dataframe['celcius_column'] = dataframe['fahrenheit_column'].apply(convert)NameError: name 'dataframe' is not defineddef convert_to_celcius(fahrenheit):
"""Convert temperature to Celcius"""
return (fahrenheit - 32) * 5 / 9
rapid_df['TCel'] = rapid_df['TOBS'].apply(convert_to_celcius)/tmp/ipykernel_4275/2120535367.py:5: SettingWithCopyWarning:
A value is trying to be set on a copy of a slice from a DataFrame.
Try using .loc[row_indexer,col_indexer] = value instead
See the caveats in the documentation: https://pandas.pydata.org/pandas-docs/stable/user_guide/indexing.html#returning-a-view-versus-a-copy
rapid_df['TCel'] = rapid_df['TOBS'].apply(convert_to_celcius)Often when working with time-series data you may want to focus on a shorter window of time, or look at weekly, monthly, or annual summaries to help make the analysis more manageable.
For this demonstration, we will look at the last 40 years worth of data and resample to explore a summary from each year that data were recorded.
# Subset the data
new_dataframe = dataframe.loc['start-year':'end-year']
new_dataframe
NameError: name 'dataframe' is not defined# Subset the data
rapid_1983_2023_df = rapid_df.loc['1983':'2023']
rapid_1983_2023_df| PRCP | TOBS | TCel | |
|---|---|---|---|
| DATE | |||
| 1983-01-01 | 0.00 | 30.0 | -1.111111 |
| 1983-01-02 | 0.00 | 29.0 | -1.666667 |
| 1983-01-03 | 0.00 | 40.0 | 4.444444 |
| 1983-01-04 | 0.00 | 33.0 | 0.555556 |
| 1983-01-05 | 0.00 | 43.0 | 6.111111 |
| ... | ... | ... | ... |
| 2023-12-27 | 0.31 | 32.0 | 0.000000 |
| 2023-12-28 | 0.00 | 17.0 | -8.333333 |
| 2023-12-29 | 0.00 | 28.0 | -2.222222 |
| 2023-12-30 | 0.00 | NaN | NaN |
| 2023-12-31 | 0.00 | NaN | NaN |
13939 rows × 3 columns
# DO NOT MODIFY THIS TEST CELL
df_resp = _
points = 0

if isinstance(df_resp, pd.DataFrame):
    points += 1
    print('\u2705 Great work! You called a DataFrame.')
else:
    print('\u274C Oops - make sure to call your DataFrame for testing.')

summary = [round(val, 2) for val in df_resp.mean().values]
if summary == [0.06, 55.67, 13.15]:
    points += 5
    print('\u2705 Great work! You correctly converted to Celcius.')
else:
    print('\u274C Oops - your data are not correct.')
print('You earned {} of 5 points for subsetting'.format(points))
✅ Great work! You called a DataFrame.
❌ Oops - your data are not correct.
You earned 1 of 5 points for subsettingHere you will resample the 1983-2023 data to look the annual mean values.
# Resample the data to look at yearly mean values
resampled_data = new_dataframe.resample('TIME').STAT()
resampled_data
NameError: name 'new_dataframe' is not defined# Resample the data to look at yearly mean values
rapid_ann_mean_df = rapid_1983_2023_df.resample('YS').mean()
rapid_ann_mean_df| PRCP | TOBS | TCel | |
|---|---|---|---|
| DATE | |||
| 1983-01-01 | 0.038849 | 59.302632 | 15.168129 |
| 1984-01-01 | 0.026145 | 54.458182 | 12.476768 |
| 1985-01-01 | 0.039091 | 50.691667 | 10.384259 |
| 1986-01-01 | 0.069551 | 53.672673 | 12.040374 |
| 1987-01-01 | 0.039011 | 56.988950 | 13.882750 |
| 1988-01-01 | 0.028017 | 56.983240 | 13.879578 |
| 1989-01-01 | 0.056359 | 38.072829 | 3.373794 |
| 1990-01-01 | 0.039068 | 40.363112 | 4.646174 |
| 1991-01-01 | 0.056875 | 39.945869 | 4.414372 |
| 1992-01-01 | 0.036714 | 39.525862 | 4.181034 |
| 1993-01-01 | 0.055881 | 35.522581 | 1.956989 |
| 1994-01-01 | 0.034540 | 39.479769 | 4.155427 |
| 1995-01-01 | 0.063609 | 39.150568 | 3.972538 |
| 1996-01-01 | 0.058785 | 36.547486 | 2.526381 |
| 1997-01-01 | 0.057634 | 38.825073 | 3.791707 |
| 1998-01-01 | 0.068343 | 40.563739 | 4.757633 |
| 1999-01-01 | 0.073104 | 41.688202 | 5.382335 |
| 2000-01-01 | 0.050771 | 39.750751 | 4.305973 |
| 2001-01-01 | 0.049639 | 43.371134 | 6.317297 |
| 2002-01-01 | 0.036126 | 33.482143 | 0.823413 |
| 2003-01-01 | 0.039186 | 40.455253 | 4.697363 |
| 2004-01-01 | 0.030242 | 38.877828 | 3.821016 |
| 2005-01-01 | 0.044620 | 40.627119 | 4.792844 |
| 2006-01-01 | 0.042870 | 40.873278 | 4.929599 |
| 2007-01-01 | 0.038515 | 34.806931 | 1.559406 |
| 2008-01-01 | 0.025892 | 34.204969 | 1.224983 |
| 2009-01-01 | 0.053828 | 35.871324 | 2.150735 |
| 2010-01-01 | 0.056767 | 39.012384 | 3.895769 |
| 2011-01-01 | 0.060282 | 40.313846 | 4.618803 |
| 2012-01-01 | 0.019341 | 42.008746 | 5.560415 |
| 2013-01-01 | 0.060685 | 38.392638 | 3.551466 |
| 2014-01-01 | 0.057726 | 39.211310 | 4.006283 |
| 2015-01-01 | 0.057260 | 41.351275 | 5.195153 |
| 2016-01-01 | 0.039508 | 42.161644 | 5.645358 |
| 2017-01-01 | 0.034082 | 41.013889 | 5.007716 |
| 2018-01-01 | 0.057335 | 36.670732 | 2.594851 |
| 2019-01-01 | 0.085056 | 36.159544 | 2.310858 |
| 2020-01-01 | 0.044006 | 41.023438 | 5.013021 |
| 2021-01-01 | 0.032225 | 40.363248 | 4.646249 |
| 2022-01-01 | 0.028421 | 39.331395 | 4.072997 |
| 2023-01-01 | 0.046313 | 40.144578 | 4.524766 |
# DO NOT MODIFY THIS TEST CELL
df_resp = _
points = 0

if isinstance(df_resp, pd.DataFrame):
    points += 1
    print('\u2705 Great work! You called a DataFrame.')
else:
    print('\u274C Oops - make sure to call your DataFrame for testing.')

summary = [round(val, 2) for val in df_resp.mean().values]
if summary == [0.06, 55.37, 12.99]:
    points += 5
    print('\u2705 Great work! You correctly converted to Celcius.')
else:
    print('\u274C Oops - your data are not correct.')
print('You earned {} of 5 points for resampling'.format(points))
✅ Great work! You called a DataFrame.
❌ Oops - your data are not correct.
You earned 1 of 5 points for resampling# Plot mean annual temperature values# Plot the data using .plot
rapid_ann_mean_df.plot(
y='TOBS',
title='Daily Precipitation in Rapid City, SD',
xlabel='Date',
ylabel='Precipitation (mm)')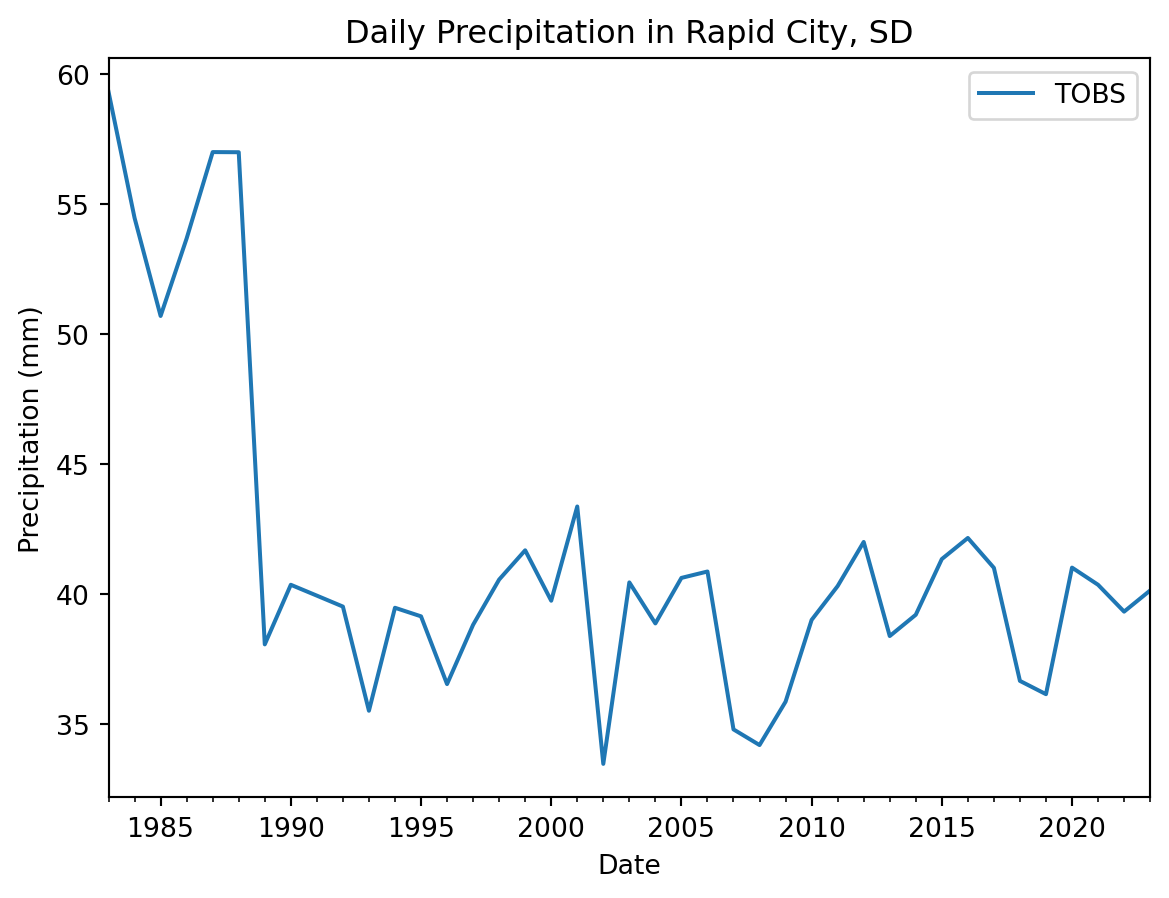
Describe your plot in this cell in 2-3 sentences

Image credit: https://www.craiyon.com/image/OAbZtyelSoS7FdGko6hvQg
Don’t forget to reproduce your analysis in a new location or time!

Image source: https://www.independent.co.uk/climate-change/news/by-the-left-quick-march-the-emperor-penguins-migration-1212420.html
Below (or in a new notebook!), recreate the workflow you just did in a place that interests you OR with a different measurement. See the instructions above to adapt the URL that we created for Rapid City, CO using the NCEI API. You will need to make your own new Markdown and Code cells below this one, or create a new notebook.

Image source: https://dfwurbanwildlife.com/2018/03/25/chris-jacksons-dfw-urban-wildlife/snow-geese-galore/